


Skip to content
The Crypto Playback Subscribe free
The Crypto Playback mascot: Uncle Sam with Bitcoin glasses pointing at you

The Crypto Playback: daily Bitcoin and crypto market research

Daily research and news on Bitcoin and digital assets

  • 24 live indicators
  • 15 min market data refresh
  • 4×/week free briefing
BTC$80,512.00▲ 2.8%
ETH$2,422.83▲ 4.6%
BNB$713.99▲ 1.7%
XRP$1.32▲ 3.3%
SOL$96.48▲ 3.5%
TRX$0.32▼ 1.1%

Top 6 by market cap · Prices via CoinGecko · NOV. 5, 2026 · 2:26 AM CT

Market Snapshot

Updated NOV. 5, 2026 · 2:26 AM CT
0100
50
Neutral
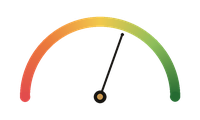
Fear & Greed Index

The market is currently showing a neutral-leaning profile, with low volatility risk and accumulation capital flow. NFT is leading sector rotation, and participation across tracked assets looks broad. At 50 out of 100, the Fear & Greed Index sits in Neutral territory, meaning neither buyers nor sellers are clearly in control, so the market is waiting for a catalyst.

Signal Confluence

Updated NOV. 5, 2026 · 2:26 AM CT
6/13

signals positive. Signals are mixed, roughly split between positive and cautious readings.

Fear & Greed
50
Neutral
Negative
Biggest Mover (24H)
ETH +4.6%
Positive
Risk Radar
LOW
Positive
Capital Flow
73
Accumulation
Positive
Top Sectors
3/3
positive
Positive
Leverage Heat
+0.010%
Elevated Long Leverage
Negative
Stablecoin Liquidity
$295.7B
-1.7%
Negative
DeFi Pulse
$84.9B
-1.3%
Negative
Miner Health
1028 EH/s
Stable
Negative
Liquidations
$0.83M
Short Liquidations Dominant
Negative
Macro Risk
LOW
VIX 16.6
Positive
ETF Flow
$-115.6M
3d outflow
Negative
Narrative Momentum
RWA +18.0%
Positive

Each signal is a Crypto Playback reading of live market data. The Capital Flow score is a composite of price and sector breadth weighted against sentiment; it is not institutional transaction data. How we read the signals

What Changed

vs. about 24 hours ago
Fear & Greed shifted
34 → 50 (+16)
Sector leadership rotated
AI → NFT
Biggest mover changed
ZEC → ETH
DeFi TVL moved
$82.0B → $84.9B (+2.9B)
Macro Risk shifted
MODERATE → LOW

Each indicator is compared with its own reading from about 24 hours earlier. Bitcoin ETF flow compares with the prior trading day because it only updates once a day.

Alerts & Indicators

Updated NOV. 5, 2026 · 2:26 AM CT

Sixteen live readings of crypto market mood, risk, flows and structure. Each card links to its full methodology, data source and recent history.

Fear & Greed Index Fear and Greed gauge
50Neutral
Daily fear and greed sentiment indicator Updated NOV. 5, 2026 · 2:26 AM CT NegativeView full breakdown →
Biggest Mover (24H) ETH+4.6% Top 10 coins by market cap, ranked by size of move Updated NOV. 5, 2026 · 2:26 AM CT PositiveView full breakdown → Risk Radar LOW Overall crypto market risk indicator Updated NOV. 5, 2026 · 2:26 AM CT PositiveView full breakdown → Capital Flow
73Accumulation
Price & sector breadth vs. sentiment Updated NOV. 5, 2026 · 2:26 AM CT PositiveView full breakdown →
Top Sectors
NFT+3.5%
L1+2.8%
L2+2.6%
Best-performing sectors, 24H Updated NOV. 5, 2026 · 2:26 AM CT PositiveView full breakdown →
Altcoin Rotation
59.5%In Line
BTC leading by 0.5pp over 24h Updated NOV. 5, 2026 · 2:26 AM CT NeutralView full breakdown →
Leverage Heat
+0.010%Elevated Long Leverage
$2.71B BTC perp open interest Updated NOV. 5, 2026 · 2:26 AM CT NegativeView full breakdown → View in the Playback Lab →
Stablecoin Liquidity
$295.7BContracting
-1.7% over 7 days Updated NOV. 5, 2026 · 2:26 AM CT NegativeView full breakdown → View in the Playback Lab →
DeFi Pulse
$84.9BShrinking
-1.3% over 7 days Updated NOV. 5, 2026 · 2:26 AM CT NegativeView full breakdown →
Miner Health
1028 EH/sStable
1 sat/vB · 52,116 pending Updated NOV. 5, 2026 · 2:26 AM CT NegativeView full breakdown →
Liquidations
$0.83MShort Liquidations Dominant
$0.2M long · $0.7M short Updated NOV. 5, 2026 · 2:26 AM CT NegativeView full breakdown → View in the Playback Lab →
Whale Activity
18Elevated
$199.2M across whale-sized transfers Updated NOV. 5, 2026 · 2:26 AM CT NeutralView full breakdown →
Macro Risk LOW VIX 16.6 · DXY 101.4 Updated NOV. 5, 2026 · 2:26 AM CT PositiveView full breakdown →
ETF Flow
-115.6MStrong Outflow
3D Outflow Streak · 2026-11-03 Updated NOV. 3, 2026 NegativeView full breakdown → View in the Playback Lab →
Market Breadth BUILDING (37/50 DAYS) Share of tracked coins above their moving average Updated NOV. 5, 2026 NeutralView full breakdown → Narrative Momentum
RWA+18.0%
L2+4.0%
NFT+3.1%
7-day average · 2026-11-05 Updated NOV. 5, 2026 PositiveView full breakdown →

The Top News Stories

Refreshed and updated daily
Latest playback · November 02, 2026

Hack Hangover Meets Tokenization Pushback

Crypto is still cleaning up after the Binance hack while a parallel fight over tokenized stocks and a fresh exchange breach in Brazil keep the ledger of bad news growing.

Browse the full archive

The Crypto Playback mascot inviting you to subscribe
Join The Playback

Subscribe for free and don't miss another top story

Four concise briefings a week (Monday, Wednesday, Friday and Saturday): live market signals, what changed since the last issue, and the stories that matter for Bitcoin and digital assets. Subscribe now and automatically unlock VIP OG status.

Free (for now). Unsubscribe anytime. No spam. We don't share your info.

Decode The Dashboard

What every signal measures

What each alert above actually measures, and how it is calculated. Tap any signal name for the full methodology, data sources and history.

Fear & Greed Index

A 0–100 read on overall market mood, from Extreme Fear to Extreme Greed. Calculated daily from real volatility, momentum, and social data, not opinion. Extremes often line up with emotional turning points, not rational ones.

Biggest Mover (24H)

Whichever of the top 10 coins in the crypto market (by market cap, stablecoins excluded) moved the most — up or down — over the last 24 hours. Ranked purely by the size of the move, not its direction. A quick read on where the action is happening right now.

Risk Radar

A simple Low, Moderate, or Elevated snapshot of how turbulent the market is right now, built from volatility and sentiment extremes. It's a temperature check on current conditions, not a forecast of what happens next.

Capital Flow

A Crypto Playback composite score built from price and sector breadth weighted against sentiment — not institutional transaction data. A higher score leans toward accumulation, a lower score toward distribution.

Top Sectors

Ranks major crypto narratives, like AI, RWA, and DeFi, by 24-hour performance. Pulled from a curated list of major sectors so tiny micro-categories can't skew the results. Shows where money is rotating inside the market, not just up or down overall.

Altcoin Rotation / BTC Dominance

Bitcoin's share of total crypto market cap, plus whether the other tracked coins are outperforming or underperforming BTC over the last 24 hours. Rising alt participation reads as broader breadth, not a price prediction for either side.

Leverage Heat

BTC perpetual futures funding rate - the periodic payment between long and short leverage positions. Elevated readings in either direction mean one side is more crowded with leverage, which raises liquidation-cascade risk, not a directional price call.

Stablecoin Liquidity

Tracks total stablecoin supply and its 7-day change — a proxy for how much capital is parked in the crypto ecosystem, ready to deploy. Expanding supply means fresh capital is entering; contracting means it's leaving the space entirely.

DeFi Pulse

Total value locked (TVL) across DeFi protocols, all chains combined, and its 7-day change. A different read than Stablecoin Liquidity - this is capital actually deployed into DeFi, not just dry powder sitting on the sidelines.

Miner Health / Network Activity

Bitcoin network hash rate and its trend into the next difficulty adjustment, plus current mempool congestion. Rising hash rate means more mining power is actively securing the network - a security/health read, not a price signal.

Liquidations

The size and direction of BTC perpetual futures liquidations - forced closeouts of over-leveraged positions - over the most recent ~100 events on OKX. Heavy liquidations in either direction mean forced, cascading action, not a directional price call.

Whale Activity

The count of $1M+ BTC transactions in a sample of recent network activity. Purely a size read - we can't tell whether a large transfer is accumulation, distribution, or just an exchange moving its own coins, so this deliberately isn't scored positive or negative.

Macro Risk

A Low/Moderate/Elevated read on traditional-market conditions - equity volatility (VIX) and US dollar strength (DXY) - the only indicator here that looks outside crypto. A temperature check on macro turbulence, not a crypto-specific signal.

Bitcoin ETF Flow

Net daily flow across US spot Bitcoin ETFs, plus a rolling streak and flow-pressure score. Positive means the funds took in more money than left them that day, not a price call. Cross-checked against a second, independent data source before it's shown.

Market Breadth

The share of a fixed 40-coin universe currently trading above its own 50-day moving average. A broad measure of how widespread the current trend actually is, not just whether a few large coins are moving.

Narrative Momentum

Ranks sectors by their trailing 7-day average daily performance, not just today's snapshot - a different cut than Top Sectors, surfacing sustained strength over a single good day.